Displacement – time graph:
1. The slope of displacement – time graph gives velocity. A and B are two points on the graph and AC is parallel to x axis and BC is perpendicular to AC.
The change in displacement is BC = ![]() and the change in time is AC =
and the change in time is AC = ![]() .
.
The slope of the graph = ![]() (where
(where ![]() is the angle with positive x axis)
is the angle with positive x axis)
= ![]() =
= ![]() = velocity.
= velocity.

2. Displacement – time graph is a straight line parallel to time axis gives zero velocity or particle is at rest. Graph indicates that there is no change in displacement for change in time.

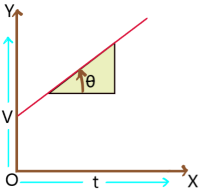
3. Displacement – time graph of a particle with constant velocity: The angle θ with time axis is in anticlockwise direction and it is constant. So the slope of the graph i.e. velocity is positive and constant.

4. Displacement – time graph of a particle with retarded motion: In this graph slope decreases with time. So, velocity decreases with time. i.e. retarded motion.

Displacement – time graph of a particle with accelerated motion: In this graph slope increasing with time. So, velocity increasing with time, i.e. accelerated motion.

Velocity – time graph:
1. The slope of velocity – time graph gives acceleration. A and B are two points on the graph and AC is parallel to x axis and BC is perpendicular to AC. The change in velocity is BC = ![]() and the change in time is AC =
and the change in time is AC = ![]() . The slope of the graph =
. The slope of the graph = ![]() (where
(where ![]() is the angle with positive x axis.) =
is the angle with positive x axis.) = ![]() =
= ![]() = acceleration.
= acceleration.

2. Velocity – time graph of a particle with zero acceleration: This graph is a straight line parallel to time axis gives zero acceleration of the particle as slope is zero. So, particle is moving with constant velocity. Graph indicates that there is no change in velocity for change in time.

3. Velocity – time graph of a particle with constant acceleration: This graph is a straight line. So, angle θ with time axis is constant and in anticlockwise direction. Therefore, slope is positive and constant. Therefore, the graph represents a particle is moving with initial velocity and constant positive acceleration.

This velocity – time graph represents the constant acceleration of a particle with zero initial velocity.

Area under the graph:
1. A particle is moving with constant velocity and velocity – time graph of it is given. Where OB (= v) represents velocity and OA (= t) represents time. The distance travelled by the particle in time t is s = velocity ![]() time = OB
time = OB ![]() OA = area of rectangle OBCA.
OA = area of rectangle OBCA.

2. A particle is moving with constant acceleration and acceleration – time graph of it is given. Where OB (= a) represents acceleration and OA (= t) represents time.
The velocity of the particle in time t is v = acceleration ![]() time = OB
time = OB ![]() OA = area of rectangle OBCA.
OA = area of rectangle OBCA.

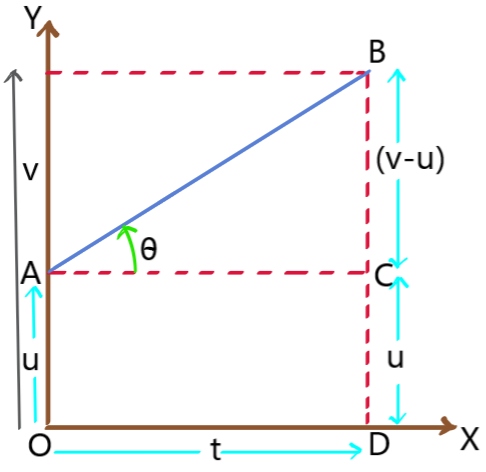
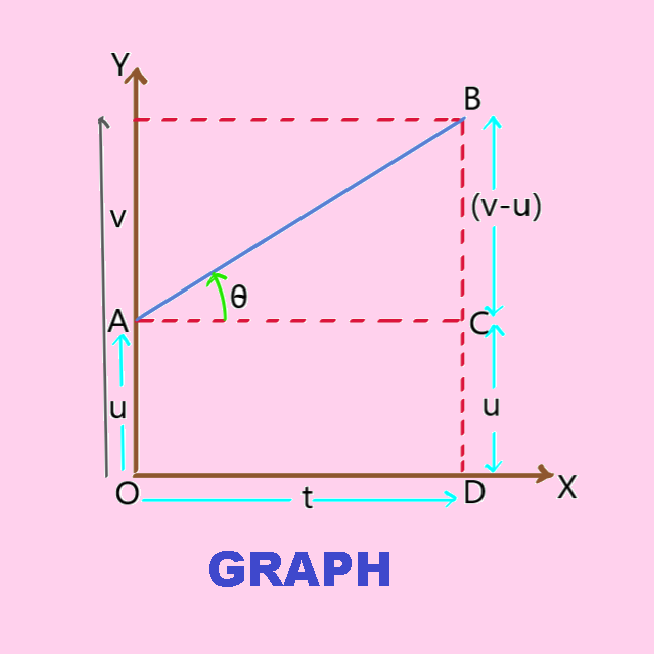
Graphical prove (v = u + at): Let us consider u is the initial velocity of the particle at t = 0 and v is the final velocity of the particle after time t. A and B are the two points on the curve corresponding to t = 0 and t = t respectively. BD is perpendicular on time axis and AC is perpendicular on BD.
OA = CD = u, BC = (v – u) and OD = AC = t.
Now slope of v-t graph = acceleration (a)
Slope of v-t graph = ![]() =
= ![]() =
= ![]()
Or, ![]()
Or, at = v – u
![]() v = u + at.
v = u + at.

Graphical prove (![]() ): Let us consider u is the initial velocity of the particle at t = 0 and v is the final velocity of the particle after time t. A and B are the two points on the curve corresponding to t = 0 and t = t respectively. BD is perpendicular on time axis and AC is perpendicular on BD.
): Let us consider u is the initial velocity of the particle at t = 0 and v is the final velocity of the particle after time t. A and B are the two points on the curve corresponding to t = 0 and t = t respectively. BD is perpendicular on time axis and AC is perpendicular on BD.
OA = CD = u, BC = (v – u) and OD = AC = t
The distance travelled by it for time t is s = area under the v-t graph
Or, s = area of trapezium OABD
Or, s = area of rectangle OACD + area of triangle ABC
Or, s = OA ![]() OD +
OD + ![]() BC
BC ![]() AC
AC
Or, s = ut + ![]() (v – u)t
(v – u)t
![]()
![]() [as v = u + at].
[as v = u + at].

Graphical prove (v2 = u2 + 2as): Let us consider u is the initial velocity of the particle at t = 0 and v is the final velocity of the particle after time t. A and B are the two points on the curve corresponding to t = 0 and t = t respectively. BD is perpendicular on time axis and AC is perpendicular on BD.
OA = CD = u, BC = (v – u) and OD = AC = t
The distance travelled by it for time t is s = area under the v – t graph
Or, s = area of trapezium OABD
Or, s = ![]() [sum of parallel sides
[sum of parallel sides ![]() perpendicular distance between parallel sides]
perpendicular distance between parallel sides]
Or, s = ![]() [OA + BD] AC =
[OA + BD] AC = ![]() [u + v]t
[u + v]t
Or, 2s = ![]() [as v = u + at]
[as v = u + at]
Or, 2as = v2 – u2
![]() v2 = u2 +2as.
v2 = u2 +2as.

