
Graph
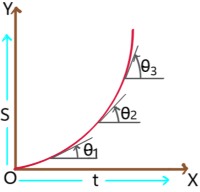
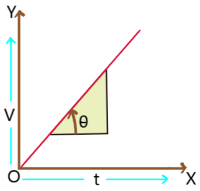
Displacement – time graph:
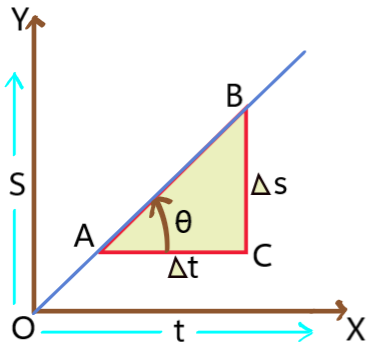
i). The slope of displacement – time graph gives velocity. A and B are two points on the graph and AC is parallel to x axis and BC is perpendicular to AC.
The change in displacement is BC =  and the change in time is AC =
  .
.
The slope of the graph =  (where
  is the angle with positive x axis)
=  =
= ![]() = velocity.
= velocity.
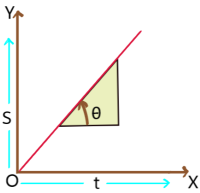
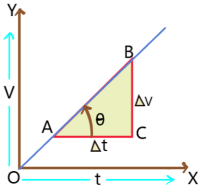
Velocity – time graph:
1. The slope of velocity – time graph gives acceleration. A and B are two points on the graph and AC is parallel to x axis and BC is perpendicular to AC. The change in velocity is BC =  and the change in time is AC = . The slope of the graph = (where is the angle with positive x axis.) = =
 ![]() = acceleration.
= acceleration.
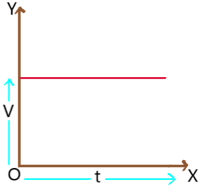
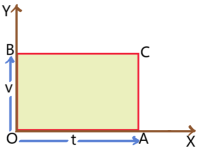
Area under the graph:
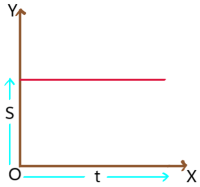
1. A particle is moving with constant velocity and velocity – time graph of it is given. Where OB (= v) represents velocity and OA (= t) represents time. The distance travelled by the particle in time t is s = velocity  time = OB OA = area of rectangle OBCA.
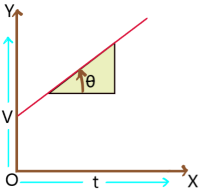
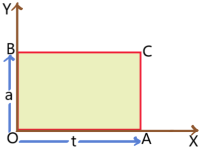
2. A particle is moving with constant acceleration and acceleration – time graph of it is given. Where OB (= a) represents acceleration and OA (= t) represents time.
The velocity of the particle in time t is v = acceleration time = OB OA = area of rectangle OBCA.
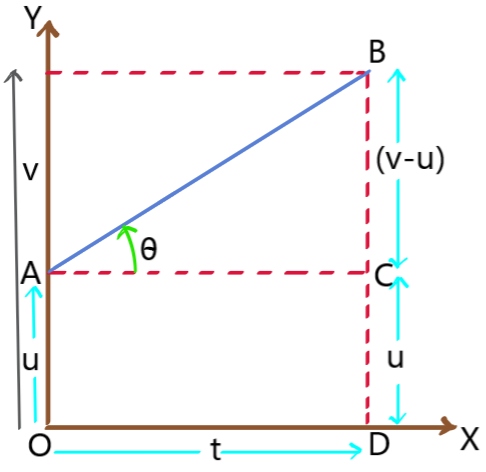
Graphical prove (v = u + at): Let us consider u is the initial velocity of the particle at t = 0 and v is the final velocity of the particle after time t. A and B are the two points on the curve corresponding to t = 0 and t = t respectively. BD is perpendicular on time axis and AC is perpendicular on BD.
OA = CD = u, BC = (v – u) and OD = AC = t.
Now slope of v-t graph = acceleration (a)
Slope of v-t graph = = = 
Or, 
Or, at = v – u
 v = u + at.
Graphical prove ( ): Let us consider u is the initial velocity of the particle at t = 0 and v is the final velocity of the particle after time t. A and B are the two points on the curve corresponding to t = 0 and t = t respectively. BD is perpendicular on time axis and AC is perpendicular on BD.
OA = CD = u, BC = (v – u) and OD = AC = t
The distance travelled by it for time t is s = area under the v-t graph
Or, s = area of trapezium OABD
Or, s = area of rectangle OACD + area of triangle ABC
Or, s = OA OD +  BC AC
BC AC
Or, s = ut + (v – u)t
[as v = u + at].
Graphical prove (v2 = u2 + 2as): Let us consider u is the initial velocity of the particle at t = 0 and v is the final velocity of the particle after time t. A and B are the two points on the curve corresponding to t = 0 and t = t respectively. BD is perpendicular on time axis and AC is perpendicular on BD.
OA = CD = u, BC = (v – u) and OD = AC = t
The distance travelled by it for time t is s = area under the v – t graph
Or, s = area of trapezium OABD
Or, s = [sum of parallel sides perpendicular distance between parallel sides]
Or, s = [OA + BD] AC = [u + v]t
Or, 2s =  [as v = u + at]
Or, 2as = v2 – u2
v2 = u2 +2as.
tag:
Share:
Admin Koushi